Symflower trace
This page provides an overview of symflower trace, a task visualization tool that gives insights into application execution behavior.
Usage
symflower [OPTIONS] trace [trace-OPTIONS]
The command takes the following arguments:
--output-file: The file path to the trace file.--trace-file: The file path to the trace file.
Details
Use this feature to overcome some limitations of the built-in Go tool for tracing applications with go tool trace:
- Lack of clear parent-child relationships:
symflower traceprovides a hierarchical tree visualization over tasks, making it easier to visually identify parent-child relationships. - Scalability issues with large task counts:
symflower tracecan handle many tasks without sacrificing performance or usability. - Difficulty in identifying performance outliers:
symflower tracecolor-codes task execution times on a linear scale: green for fast execution times, transitioning through yellow to red for slowest ones.
The output of this command is an HTML file with a tree visualization of a trace file.
Tutorial
Example
Let's take the following example of making a sandwich:
package main

import (
    "context"
    "os"
    "runtime/trace"
    "sync"
    "time"
)

func main() {
    traceFile, err := os.Create("sandwich.trace")
    if err != nil {
        panic(err)
    }
    if err = trace.Start(traceFile); err != nil {
        panic(err)
    }
    defer func() {
        trace.Stop()
        if err := traceFile.Close(); err != nil {
            panic(err)
        }
    }()

    ctx := context.Background()
    ctx, task := trace.NewTask(ctx, "main")
    defer task.End()

    numOfWorkers := 3
    var wg sync.WaitGroup
    wg.Add(numOfWorkers)

    for i := 0; i < numOfWorkers; i++ {
        go func() {
            defer wg.Done()
            makeSandwich(ctx)
        }()
    }

    wg.Wait()
}

func makeSandwich(ctx context.Context) {
    ctx, task := trace.NewTask(ctx, "makeSandwich")
    defer task.End()

    region := trace.StartRegion(ctx, "Preparation")
    prepareIngredients(ctx)
    assembleSandwich(ctx)
    region.End()
}

func prepareIngredients(ctx context.Context) {
    ctx, task := trace.NewTask(ctx, "prepareIngredients")
    defer task.End()

    time.Sleep(200 * time.Millisecond)
}

func assembleSandwich(ctx context.Context) {
    ctx, task := trace.NewTask(ctx, "assembleSandwich")
    defer task.End()

    time.Sleep(100 * time.Millisecond)
}
At the beginning of the main function, the tracing is initialized with trace.Start and the file sandwich.trace is passed to store tracing data. Three tasks are kept track of:
- making sandwiches
- preparing ingredients
- assembling sandwiches.
context.Context is passed along the functions to establish a relation between tasks and sub-tasks. A region inside makeSandwich is created to understand how long it takes to prepare and assemble a sandwich.
When running the main function go run main.go, the trace file sandwich.trace is created in the root of the project.
Execute symflower trace
Use the generated trace file as input to the symflower trace command so it generates a tree visualization of the trace file:
symflower trace --trace-file=sandwich.trace --output-file=sandwich.html
Opening the sandwich.html file in your browser, you will see the following tree structure:
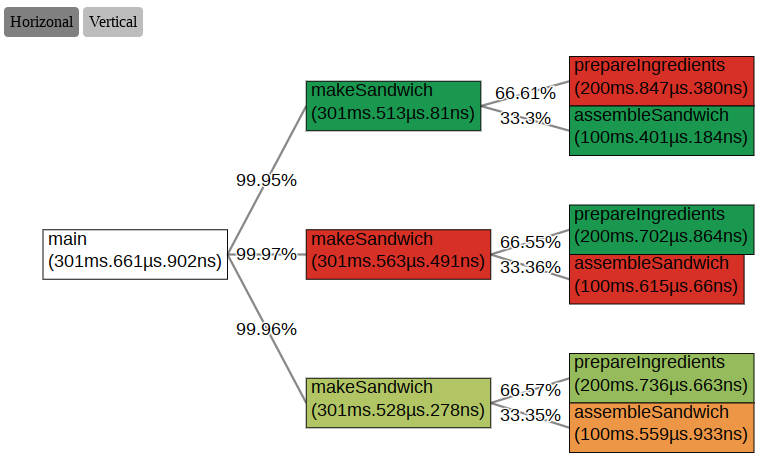
Tree analysis:
- The tasks for making the sandwiches in parallel take over 99% of the main task since they are executed concurrently.
- Color-coding allows us to identify performance outliers. For example, the
makeSandwichnode in the middle of the tree is red since it took a longer time to execute compared to the other nodes of the same task.